Security
KPN Zakelijk Blog
Hackers actiever dan ooit tevoren: neem cybersecurity nu echt serieus
Cybercriminelen hebben het ook op jouw bedrijf gemunt. Wist je bijvoorbeeld dat in 2024 bij 25 procent van de mkb-bedrijven een veiligheidsincident plaatsvond? De vraag is dus niet óf je een doelwit wordt, maar hoe goed je bent voorbereid.

Nieuwe artikelen
AI-inzet explodeert, maar hoe houd je als organisatie grip?

De paradox van cyberweerbaarheid: waarom een 7,1 niet het hele verhaal vertelt
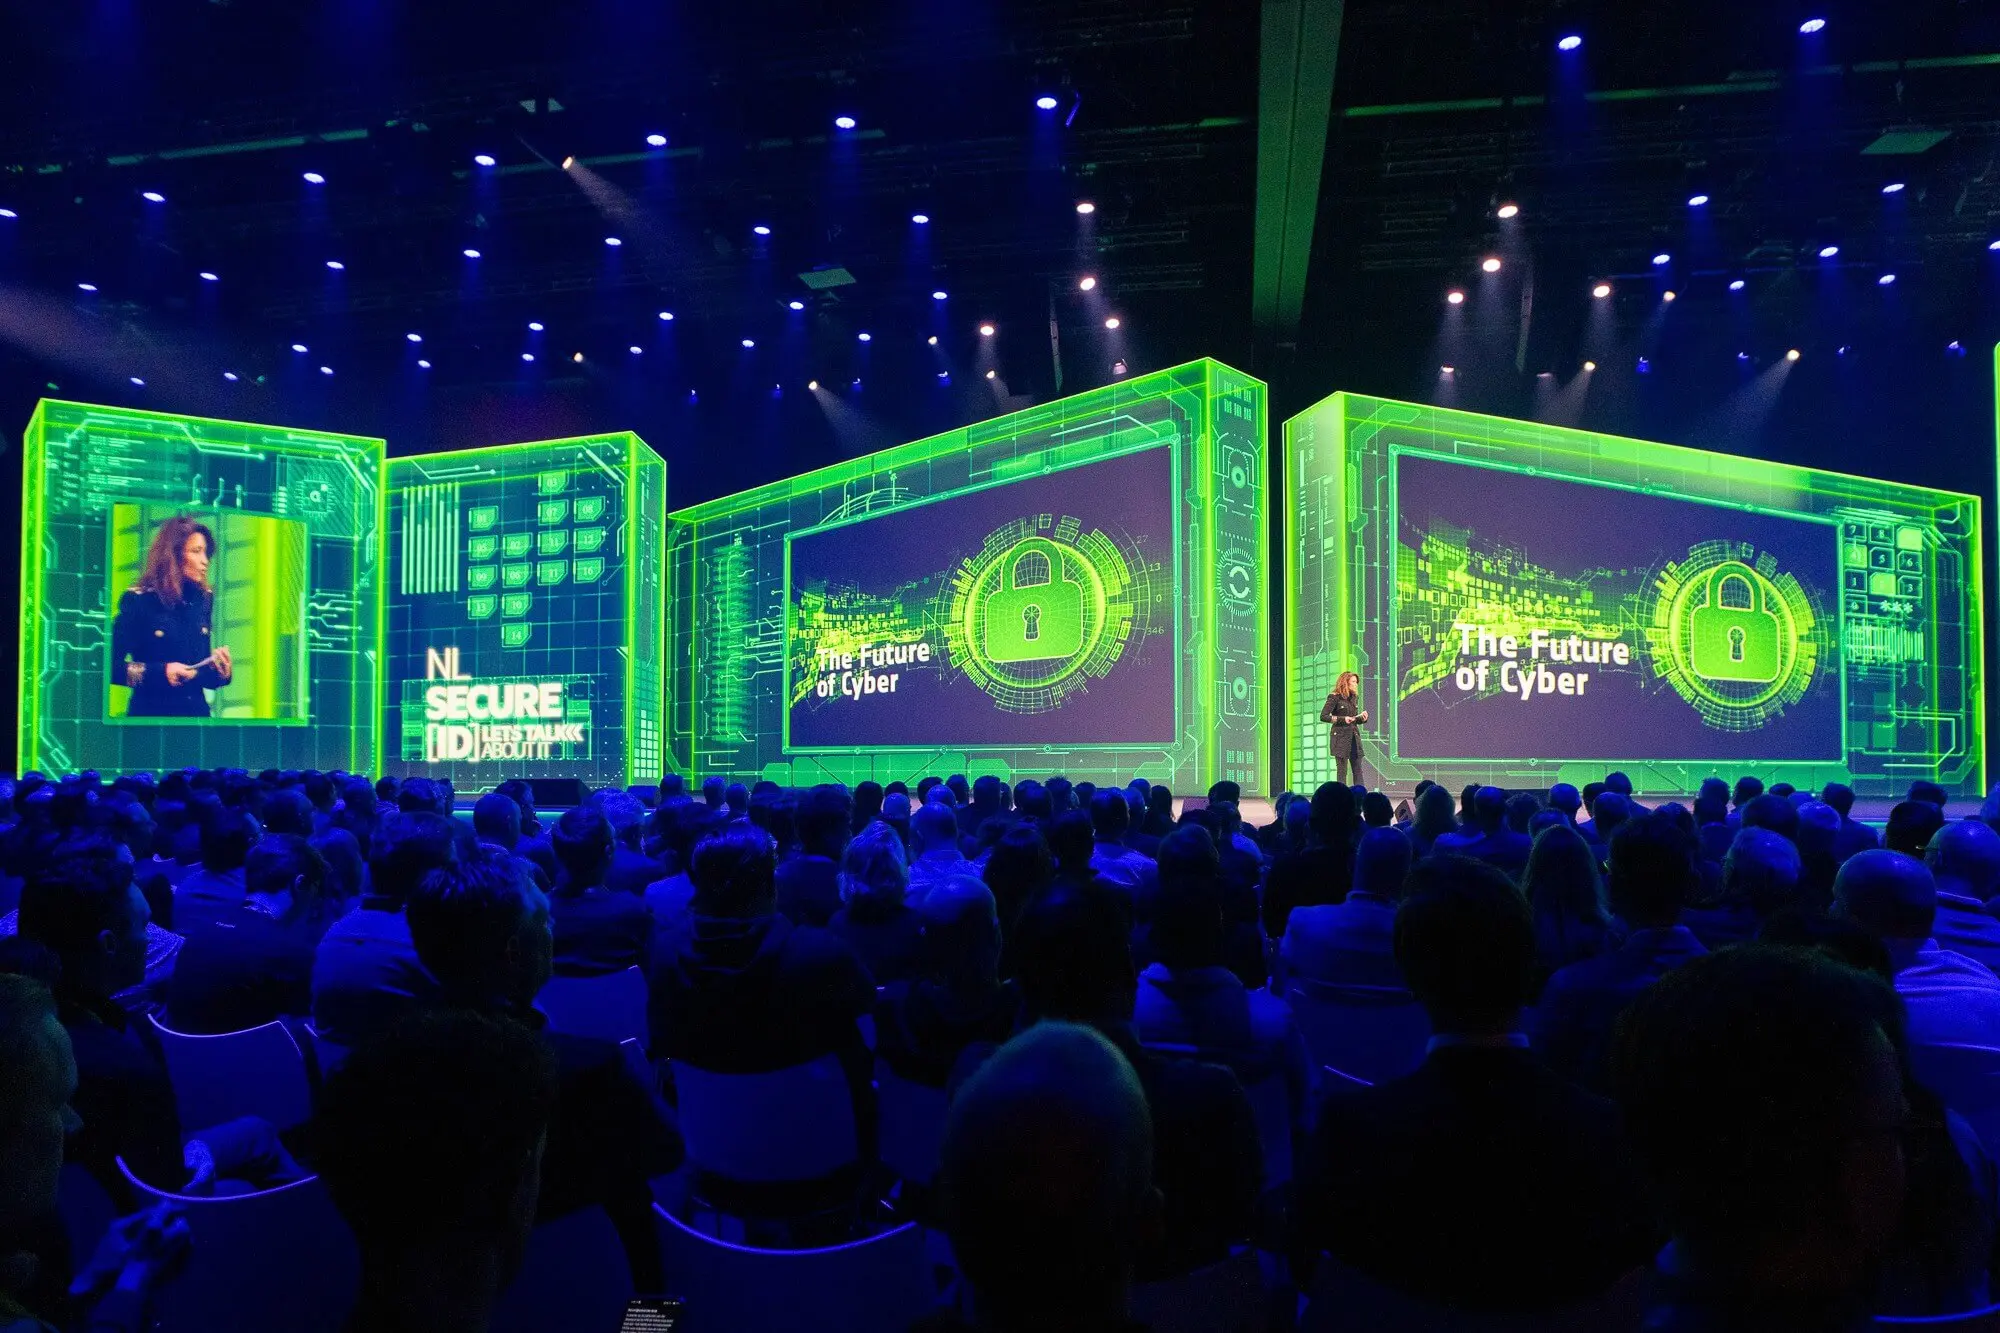
![Persoon spreekt zaal toe tijdens NLSecure[ID] event](http://images.ctfassets.net/zuadwp3l2xby/Fn2zWxTJzzoVGXoLU2S5C/a95d7403f67075b609c713f90ca7be63/Justin_Post_1.JPG?fm=webp)
9 vragen (en antwoorden) over de Cyberbeveiligingswet

De 3 belangrijkste lessen voor organisaties die echt cyberweerbaar willen zijn
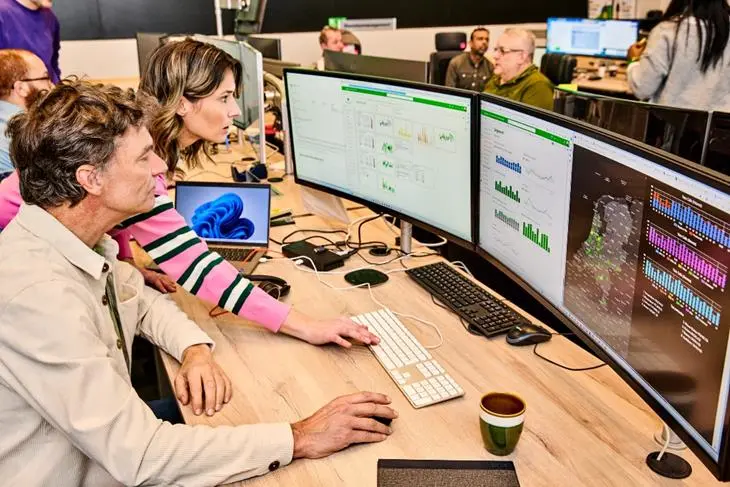
![Drie personen zitten aan tafel tijdens NLSecure[ID] event](http://images.ctfassets.net/zuadwp3l2xby/74YDWbW2vMNKlRLa2NZmuU/0ecbbf3a0de4510a383d3e1d3c16366d/Nadeem_de_Vree.JPG?fm=webp)
Is een 7,1 voor cyberweerbaarheid voldoende?

Veertig jaar cyberdreiging: what’s next?

Een NEN 7510-certificering die leeft: zo doet zorgorganisatie Cello dat
Als zorgorganisatie geef je om je mensen. Je cliënten, zorgprofessionals en andere medewerkers. Je wilt ze beschermen, hun digitale gegevens en de processen daaromheen. ‘NEN 7510 is daarvoor een perfecte kapstok,’ vertelt Mark van Engelen, ISO bij zorgorganisatie Cello. ‘Maar benader deze norm wel op een mensgerichte manier. Je wilt geen papieren tijger. Bij ons leeft het nu, zowel bij cliënten als bij de zorgteams en het management.’
Security evenementen in de agenda
Medewerkers die zelf AI-tools installeren en vervolgens vertrouwelijke informatie zoals klantgegevens in een chatbot zetten. Waarschijnlijk komt dit ook voor binnen jouw organisatie. Hoe krijg je grip op Shadow AI?

Van NIS2 naar echte weerbaarheid: securitymonitoring in de praktijk
De stopwatch van 24 uur begint pas te lopen als je het incident detecteert. Maar hoe weet je of er op dit moment iemand in je systemen zit? Zonder monitoring geen detectie. En dat raakt niet alleen je meldplicht, maar brengt ook je bedrijfscontinuïteit in gevaar.

NLSecure[ID] 2026
De 10e editie van NLSecure[ID] is op 20 januari 2026. Dit keer is het thema ‘Samen maken we Nederland veiliger’.
Cyberdreigingen raken steeds vaker de hele financiële keten. Door wet- en regelgeving zoals DORA zijn financiële instellingen niet alleen verantwoordelijk voor hun eigen security, maar ook voor die van hun leveranciers en partners. Hoe zorg je voor een weerbare keten zonder de samenwerking te verliezen? En hoe kunnen technologie en zero-trust principes hierbij helpen?
Veiligheid verbindt: security als gezamenlijke missie binnen het overheidsdomein
Hoe beschermen we Nederland tegen digitale dreigingen die geen grenzen kennen? Het antwoord is een gezamenlijke missie voor overheid en bedrijfsleven. In dit on-demand webinar ontdek je de kracht van publiek-private samenwerking in security. We gaan van internationale wetgeving tot concrete praktijkvoorbeelden. Zodat jij weet hoe we samen een veilige digitale toekomst bouwen.

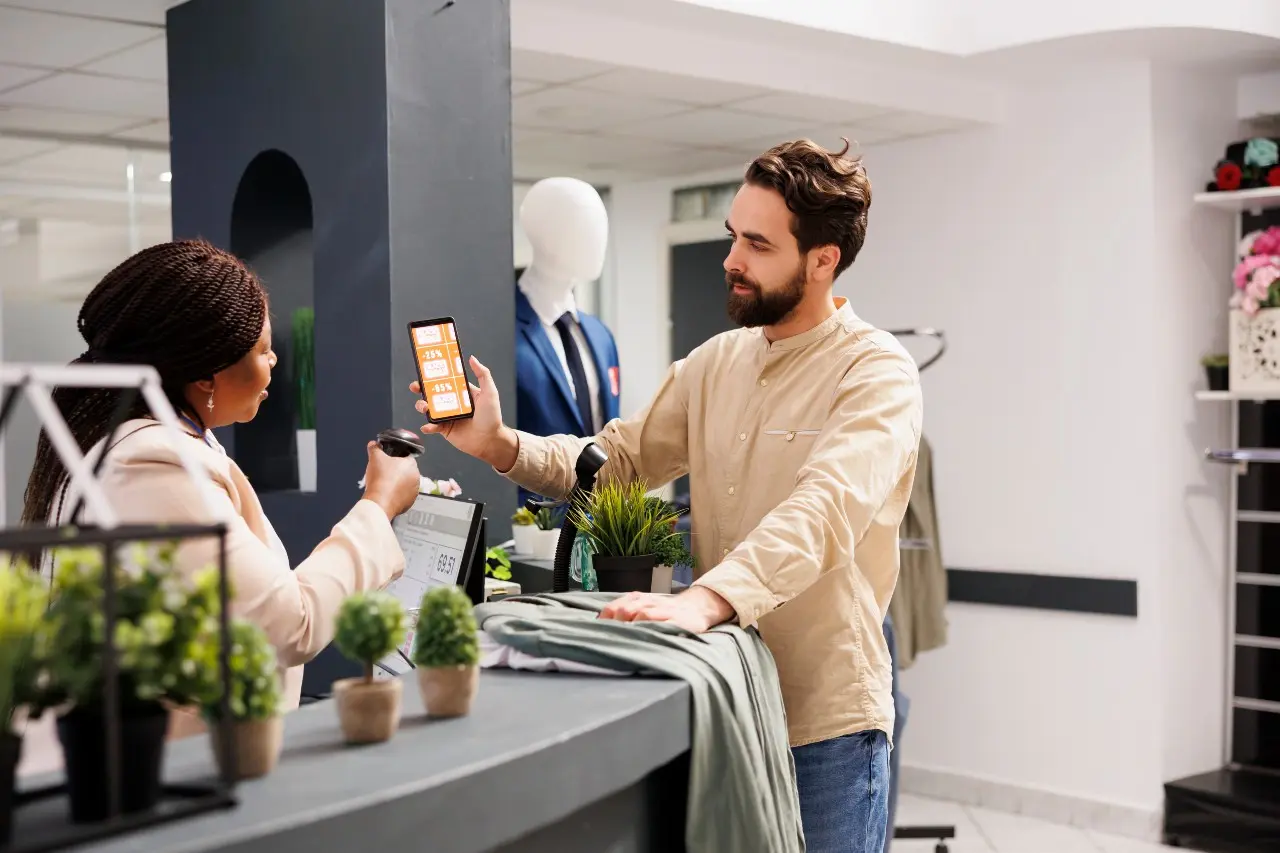
De retailsector draait non-stop. Overdag draait alles om klantcontact, ’s nachts om verwerking en bevoorrading. Dit continue proces is kwetsbaar, zeker nu retailers steeds digitaler opereren. Als er een schakel uitvalt door een cyberaanval, een stroomstoring of uitval in de keten, dan ligt de operatie direct stil. De grote vraag is dus niet óf, maar wannéér er iets gebeurt. Hoe zorg je dan dat je business blijft draaien? Grip op continuïteit begint bij inzicht in je zwakke plekken en het maken van de juiste securitykeuzes.
Luister onze podcasts
Een 7,1 voor cyberweerbaarheid zegt minder dan je denkt (met Bram de Bruijn, Justin Post, Nadeem de Vree)

Oude systemen, nieuwe dreigingen: hoe bescherm je wat je niet kunt patchen? (Met Godfried Boshuizen)

Het verschil tussen gelijk hebben en gelijk krijgen (met Joost Boele)
Wendbaarheid boven volledigheid (met Hidde Kylstra)
Hoe je als CISO koers houdt in een snel veranderend dreigingslandschap (met Corence Klop)
“Heel Holland Hacked”: waarom oefenen meer oplevert dan beleid (met Kelvin Rorive)
